
Download the entire article (.pdf file) by clicking the below icon:
[icon_list icon=”acrobat” size=”large” link=”/wp-content/uploads/2014/05/STILE-Point-16-STI-and-The-Knowledge-Economy-Key-STI-Indicators-v.final_.pdf” target=”blank”]
[clear]
In the first STILE Point on STI and the Knowledge Economy, we emphasized the importance of STI as the main source and the driving force for knowledge economy. To compete in the 21st Century a country should articulate its vision and implement strategies and programs to propel it towards a diversified and sustained knowledge-based economy. Countries should create the enabling environment to encourage entrepreneurs to commercialize proven technologies and innovative ideas.
In this STILE Point, we will highlight key STI Indicators and review and analyze some of these indicators for the BRICS group of countries, namely: Brazil, Russia (Russian Federation), India, China and South Africa and compare these indicators with other countries and regions.
Key STI Indicators
Various indictors are used to monitor and measure STI. These indicators include: (i) Research and Development (R&D) Expenditures as Percentage of GDP, (ii) Number of Researchers in R&D per Million People, (iii) R&D Expenditures per Researcher, (iv) High-Technology Exports as Percentage of Manufactured Exports, (v) ICT Exports as Percentage of Total Goods Exports (vi) Number of Scientific and Technical Journal Articles, and (vii) Number of Patents Applications field by Residents and Non-residents. In addition to the above indicators, Science Citation Index (SCI) is commonly used to measure scientific output. Other indicators such as the number of internet users per 100 people and number of smart phones and tablets per 100 people complement the above indicators.
Two Indicators will be reviewed in this STILE Point, namely: (1) R&D Expenditures as Percentage of GDP and (2) High-Technology Exports as Percentage of Manufacturing exports. Other indicators will be reviewed in future STILE Points.
R&D Expenditures as Percentage of GDP: R&D expenditures include current and capital expenditures by both public and private sectors. R&D covers basic and applied research, and experimental development to use knowledge for new applications. While this is an important indicator, one should analyze the composition of these expenditures. In some countries, R&D expenditures include a very large amount (about 85%-90%) for salaries of researchers and technicians; which leaves very little funds for research equipments, material, training and capacity building. While higher spending on R&D is important, increasing expenditures on knowledge-based intangibles such as ICT, skills and competencies is essential to prepare “knowledge workers” to support knowledge-based development.
The main sources of financing R&D are (i) public/government funding of national research institution and financing research projects in universities and the private sector, and (ii) private sector, including large corporations and Small and Medium Enterprises (SMEs) to carry out their own research and/or financing specific R&D projects in public research institutions and universities. The ratio of public and private financing of R&D varies from country to country. In the USA, the private sector currently provides about 70% of total R&D expenditures. The European Council set a target for the private sector to finance about 66% of R&D by 2020. Many courtiers provide tax breaks for the private sector to induce them to increase their investments in R&D. The share of private sector financing in the Arab World is very low — about 3%, while the public sector financed 89% and other sources funded 8% (UNDP – Arab Human Development Report, 2003).
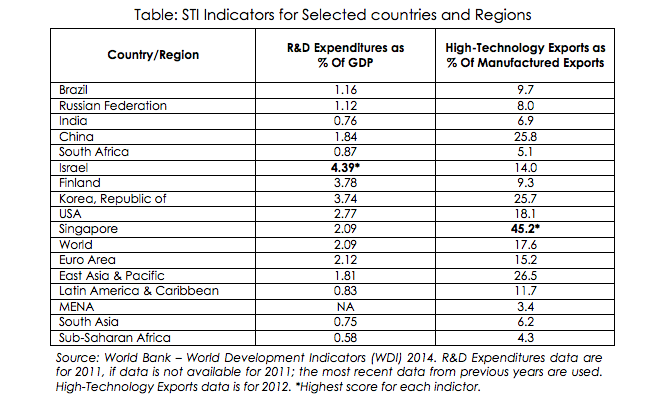
The Table below indicates that Israel has the highest R&D Expenditures as % of GDP (4.39%). In fact Israel recorded that highest score in the World of 4.39% (2011), followed by Finland 3.78% (2011) and Korea 3.74% (2010). To emphasize the importance of STI, Korea has established, in 2008, a Ministry for Knowledge Economy. The United States is planning to increase R&D expenditures as % of GDP from the current level of 2.77% to 3.0% by 2020 (National Science Foundation – Science and Engineering Indicators, 2010).
China scored that highest (1.84%) among the BRICS and India the lowest (0.76%). Realizing the value of STI, China has more than double its R&D expenditures from 0.9% in 2000 to 1.84% in 2011. Among the Regions, the Euro Area has the highest score (2.12%) and Sub-Saharan Africa the lowest (0.58%). No data was available for the MENA region. However, data is available for some of the MENA countries, which we will analyze in future STILE Points.
High-Technology Exports as % of Manufactured Exports: High-Technology exports are products with high R&D intensity, such as aerospace, computers, pharmaceuticals, scientific instruments and electrical machinery. The higher the ratio of high-technology exports to manufacturing exports the more likely a country is moving toward a diversified and knowledge based-economy. Singapore (45.2%), China (25.8%) and Korea (25.7%) score highly in this indicator (Table). This implies that; these economies are diversified and knowledge-based. China also records the highest score among the BRICS. These three countries also explain why East Asia and Pacific have the highest score (26.5%) among the regions. MENA has the lowest score. MENA countries should make concerted efforts to increase their high-technology exports so that their economies become more diversified and knowledge-based.
Table: STI Indicators for Selected countries and Regions
(click the below table for enlarged image)
To compete in the 21st Century, it is important for policymakers to know where their economies stand in terms of STI in order to design strategies and programs to move their economies towards sustained high growth and knowledge-based development. Such strategies would include business friendly environment and transparent regulations that are necessary drivers for commercialization of proven technologies and innovative ideas.
In the next STILE Points we will review and analyze key STI Indicators for other country grouping such as Gulf Cooperating Council (GCC) Countries, and the MINT group of countries, namely: Mexico, Indonesia, Nigeria and Turkey.
[hr]
Dr. Tadros has 30 years experience at the World Bank in economic development in various parts of the World: South Asia (India, Pakistan, Sri Lanka), East Asia ((Myanmar (Burma)), Sub-Saharan African (The Sudan, Ethiopia, Mozambique, Zambia, Ghana and Uganda) and the Middle East and North Africa (Egypt, Bahrain, Kuwait, Oman, Saudi Arabia, Qatar and the UAE). In addition to 10 years experience in Kuwait as a Senior Advisor to the Director General of the Kuwait Institute for Scientific Research (KISR) and a part time Senior Advisor to Kuwait Ministers of Finance. He was a member of the Panel that reviewed and commented on the Strategic Plan (2012-2016) for the Kuwait Foundation for the Advancement of Science (KFAS). Dr. Tadros recent research focused on STI and Knowledge Economy in the F.Y.R. of Macedonia, Bulgaria and Turkey.